One of the most recent effects of global warming is the minimal slowing down of sea level rise. However, the increase in planet Earth’s overall temperature may pose different effects on different parts of the world. In a new study, a team of scientists developed a map that reveals which regions on Earth are more sensitive to climate variability.
Most climate scientists know that planet Earth’s temperatures are continuously warming. They also know that some parts of the world may be more sensitive to temperature changes than others. What has been lacking is a way to identify how sensitive an ecosystem is and how to apply an indicator of sensitivity of the various parts of the planet for comparison, Tech Times reported.
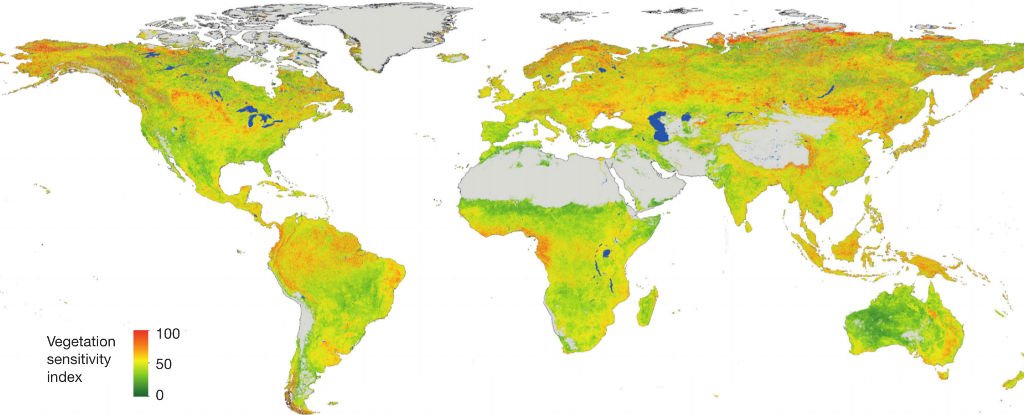
Now, researchers from the University of Bergen in Norway have developed a metric to measure the climatic sensitivity of various ecosystems. Dubbed the Vegetation Sensitivity Index, the map reveals how much a region on the planet will be affected by warming temperatures.
The team used satellite data collected from 2000 to 2013 to look at plants at a global scale. They identified climate drivers of vegetation productivity on monthly timescales and computed the sensitivity index.
In the study published in the journal Nature, the 14-year worth of satellite data measured the key climate variables of air temperature, water availability and cloud cover. The index then compares these variables with the productivity of vegetation under changing climate on a global scale.
“Based on the satellite data gathered, we can identify areas that, over the past 14 years, have shown high sensitivity to climate variability,” lead author Alistair Seddon at the university’s Department of Biology said.
Most and Least Sensitive
The whole Earth was mapped in a grid of 3.2-square-km blocks, with each one marked from most to least sensitive. Some areas, such as the Sahara or Antarctica, were labeled as completely barren or ice-covered and shown in grey on the map, Science Alert reported.
Areas shown in green have a lower sensitivity to climate change – that means they’re better able to adapt to variations in temperature, water availability and cloud cover.
The areas marked in red, on the other hand, are highly sensitive to climate change and have been hit hard by evolving weather patterns. The northern half of South America and the Scandinavian region of Europe are among those showing most red, for example.
According to the new map, the researchers found that the alpine regions worldwide, tropical rainforests, parts of the boreal forest belt and areas in the Arctic tundra are ecologically sensitive regions with heightened responses to climate change.
The new method will reveal valuable data that can be used in assessing ecosystems and anticipating how specific parts of the world will be affected by either short- or long-term climate changes. With the new map, researchers are able to show how a particular ecosystem would respond to climate at any given month, like those where it will be too cold or too hot and dry.
“Our study provides a quantitative methodology for assessing the relative response rate of ecosystems – either natural ones or those with a strong anthropogenic footprint, to climate variability,” Seddon adds.