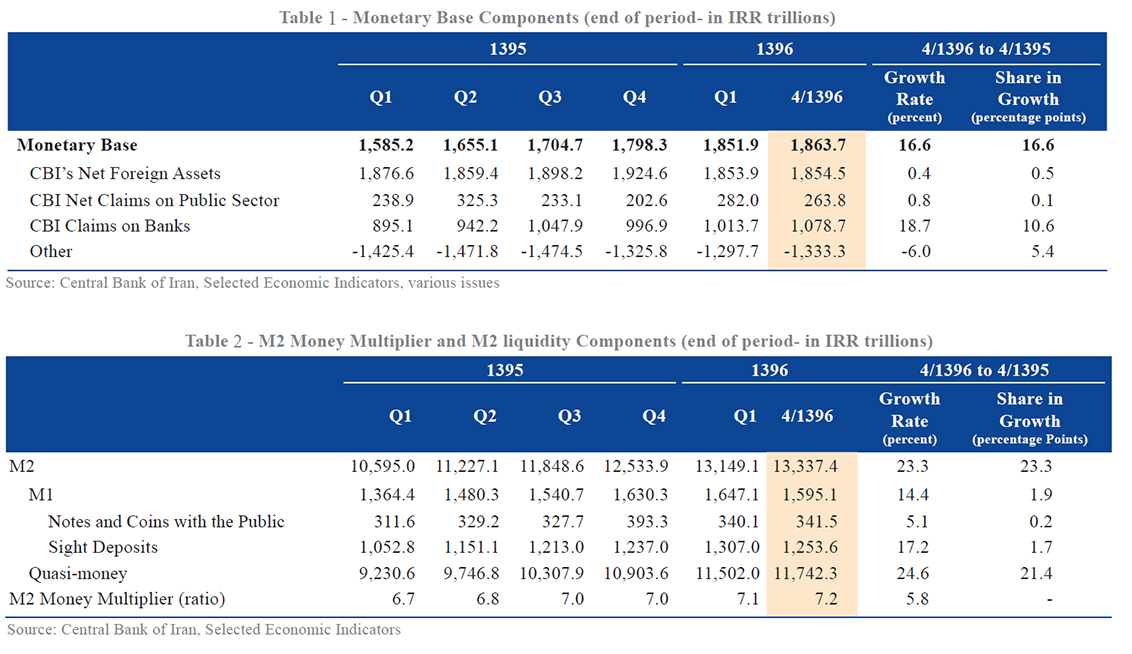
Iran’s monetary base grew by 16.6% to 1,863.7 trillion rials ($43.1 million) in June 22-July 22, 2017, 3.7 percentage points up from its level a year earlier.
The 18.7% rise in the Central Bank of Iran’s claims on banks, mainly due to the 227.9% rise in balance of CBI claims on non-public banks and non-bank credit institutions, was the major cause of this growth in monetary base.
On the other hand, CBI’s claims on state-owned commercial and specialized banks fell by 55.9% and 12.6%, respectively, the Middle East Bank’s website reported.
Compared to a year earlier, by July 22, 2017, the share of state-owned banks and non-bank credit institutions in CBI claims on banks rose from 16.6% to 45.8% while that of commercial banks fell from 19.8% to 7.4%.
The rise in CBI claims on banks could be attributed to the government requiring banks to finance a portion of its guaranteed purchase of wheat in the fiscal March 2016-17, the persistence of government reliance on banking resources to finance its supportive schemes and CBI’s requirement that banks provide credit lines for saving certain unauthorized financial institutions.
A total of 44% of the guaranteed purchase of wheat, amounting to 69.6 trillion rials ($1.6 billion) has been financed through the banking system, of which 40 trillion rials ($925 million) were financed through extended facilities and 29.6 trillion rials ($684.5 million) through the sale of Murabaha bills issued by CBI to eight banks.
During the first half of the fiscal 2016-17, the average number of interbank market transactions increased but the banks’ borrowings from the CBI remained unchanged.
However, as a result of the participation of banks in guaranteed purchase of wheat scheme in the month starting Sept. 23, 2016, the number of transactions fell but borrowings from CBI kept rising. This process intensified in Nov. 22-Jan. 20, 2017, as a result of the purchase of Murabaha bills by banks, and borrowings from the CBI peaked in Jan. 21-Feb. 19, 2017.
This intensified competition among banks for attracting deposits and raised the interest rates, thereby further exacerbating the credit crunch in H2 of the fiscal 2016-17.
The second cause of the monetary base growth was the 6% fall in net “Other” category. Net foreign assets of the CBI grew by 0.4% to 1,854.5 trillion rials ($42.8 million) and constituted the third cause of the monetary base growth.
Finally, the 0.8% rise in net CBI claims on the public sector was the last cause of the monetary base growth, accounting for 0.1 percentage points of the 16.6% growth. This is rooted in the 61.1% rise in net CBI claims on government due to the 1.2% rise in CBI claims on government and 2.9% fall in government deposits with the CBI.
On the other hand, CBI net claims on state-owned companies and institutions fell by 4.9% during the period under review as a result of a 2.2% fall in CBI claims on them and 14.0% rise in their deposits with the CBI, and considerably offset the rise in net CBI claims on the government.
Despite the fall in net CBI claims on state-owned companies and institutions, it still accounts for 86.2% of the net CBI claims on the public sector.
Table 1 exhibits the monetary base components in various quarters of the fiscal 2016-17 and 2017-18, as well as June 22-July 22, 2017.
M2 Sees 5.8% Rise
The M2 money multiplier grew by 5.8% to 7.2 by July 22, 2017. The fall in the ratios of banks’ legal reserves to total deposits, cash and coins with the public to total deposits, and sight deposits of banks with the CBI to total deposits were the reasons for the rise in M2 money multiplier.
As a result of the rise in both the M2 money multiplier and the monetary base during this period, the balance of M2 liquidity grew by 23.3% to 13,337.4 trillion rials ($308.4 million); 6.7% below the growth rate a year earlier. Table 2 exhibits the M2 money multiplier and M2 liquidity components during various quarters of 2016-18 as well as in June 22-July 22, 2017.
Among the M2 liquidity components, M1 money rose by 14.4% and quasi-money by 24.6%, accounting for 1.9 and 21.4 percentage points of the M2 liquidity growth, respectively.
Also, notes and coins with the public and sight deposits components of M1 money rose by 5.1% and 17.2%, respectively, accounting for 0.2 and 1.7 percentage points of the M2 liquidity growth.
Accordingly, the share of M1 money and quasi-money in M2 liquidity by July 22, 2017, reached 12% and 88%, respectively.
21.8% Rise in Balance of Deposits
In June 22-July 22, 2017, the balance of deposits grew by 21.8%, the balance of deposits after the deduction of legal reserves by 21.3% and extended facilities by 22.8%. As a result, the ratio of facilities to deposits after deducting legal reserves rose by 1.0 percentage point to 84%. This ratio rose gradually from May 22-June 21, 2016, to the end of the year, but reversed course in the month starting March 21, 2017. Besides, the point-to-point growth of the balance of deposits after the deduction of legal reserves touched its low in March 2017, but reversed course from the beginning of the fiscal 2017-18 while the point-to-point growth of the facilities also fell gradually.
It is worth mentioning that the average legal reserves ratio grew by 0.4 percentage points to 10.4% by July 22, 2017. During the first five months of the fiscal 2017-18, facilities worth 2,082.4 trillion rials ($48.1 million) have been extended to loan applicants, indicating a 17.4% increase.
Agriculture sector accounted for 7.3%, industries and mining for 30.1%, housing and construction for 7.4%, commerce for 14.4%, and services for 40.7% of the extended facilities. During the same period, working capital accounted for 64.1% of the extended facilities and for 85.6% of the facilities extended to industries and mining sector.
Out of the extended facilities aimed at financing working capital, 40.3% were extended to industries and mining, 32.2% to services and 17.3% percent to commerce. The extended facilities aimed at working capital in housing and construction and services fell during the first five months of the fiscal 2017-18 compared to a year earlier, but rose in other sectors.
Next to the working capital, extended facilities aimed at financing creation plans ranked second at 8.2% share of the extended facilities, out of which 46.9% were allocated to services.
On the one hand, extended facilities aimed at financing creation plans have risen in all sectors compared to the first five months of the last fiscal year.
On the other, the share of extended facilities aimed at purchasing personal goods fell in all sectors and so did its value in industries and mining, housing and construction, and services compared with the same period of last year.