In the second quarter of the current Iranian year 1395 (June 21-September 21, 2016), Iran’s crude oil production continued its upward trend of the past two years and in 7/1395 (10/2016).
This marked a rise of 19.5% compared with the same month of last year to reach 3.9 million barrels per day, according to Middle East Bank’s quarterly report on Iran’s economic performance.
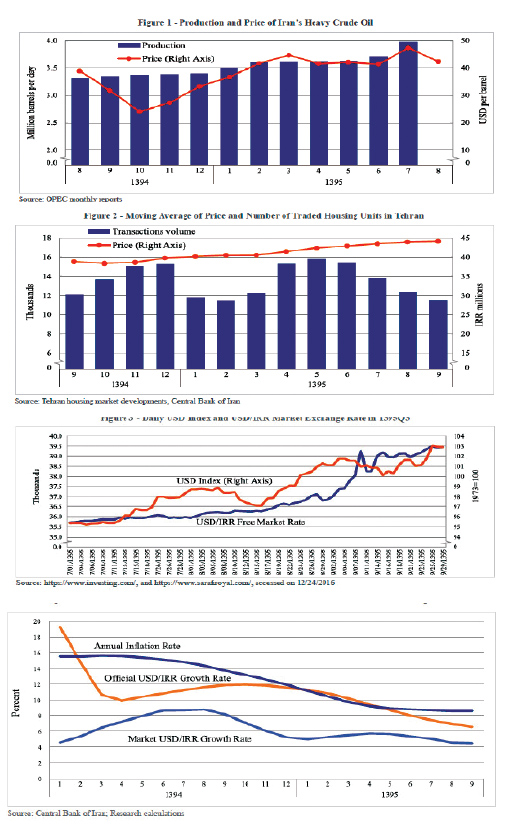
Following five months of increase, the price of Iran’s heavy crude generally declined and fluctuated in the $41-43 range per barrel. It then went up to $47.3 on the last day of 7/1395 and fell again to $42.4 in 8/1395.
Figure 1 depicts the production and price of Iran’s heavy crude oil.
For the first time during the past eight years, the 14 members of OPEC reached an agreement on November 30 to reduce their aggregate crude production by 1.2 million bpd to bring it to 32.5 million bpd.
Saudi Arabia and Iraq will have the highest production cuts while Indonesia, Libya and Nigeria will maintain their current levels and only Iran will be allowed to increase its production by 90,000 bpd to get back to its pre-sanctions level.
Following this agreement, crude oil prices jumped up above $50 per barrel.
Housing Market Coming Out of Recession
In the nine months of the year ending December 20, Iran’s housing market showed some signs of coming out of the recession of the past few years.
No official data are available on the overall housing market but data provided by the Tenement Management Information System provide some insight.
As demonstrated in Figure 2, the moving average of the price of traded residential units in Tehran has been rising since the beginning of 1395. It has experienced a 4.7% growth during the nine months of the year compared with the same period of 1394, but this rate is below the inflation rate, indicating that housing prices in real terms are still falling.
Data on the number of housing transactions indicate a moderate increase in the number of traded residential units in Tehran.
During the nine months of the year, the number of residential units traded in Tehran totaled 117,500, indicating an 8.6% rise from the same period in 1394, which indicates an improvement in the housing market.
These modest improvements on the demand side have not yet resulted in a noticeable price increase. Hence, no change in private investment is expected in the housing market.
Forex Market Volatility
The market exchange rate of the dollar was more volatile in Q3 of 1395 than in the two preceding quarters and in 9/1395 touched 39,500 and registered the highest price since President Hassan Rouhani took office.
The exchange rate was hovering around 35,000 rials during the first months of the year ending October 21, but then started to increase and averaged 38,000 rials in 9/1395.
These fluctuations are attributed to economic and political developments, both nationally and internationally.
The overall weakening of the rial versus the dollar was helped by the drop in petrochemical exports, a major source of foreign exchange supply, in 7/1395 compared with the same period of the previous year.
Additionally, increased foreign exchange demand by commercial companies for their international settlements as well as increased speculative demand pushed the dollar/rial exchange rate up from the demand side.
Figure 3 depicts the daily free market dollar/rial exchange rate in Q3 of 1395.
Recent changes in the dollar index, which measure the value of the dollar against six major world currencies, imply the global strengthening of the dollar.
This index started a moderate upward trend when the US economy exited from its 2008 financial crisis, but in November 2016 within three weeks of Donald Trump’s victory in the US presidential election surged and for the first time surpassed 100.
The fall in the US unemployment rate to 4.6% also indicates that the economy has improved and hence will further strengthen the dollar.
Such factors eventually led to a 0.25 percentage points increases in US interest rates on December 14.
Despite the fact that the Iranian foreign exchange market is not significantly affected by international developments given the intervention of CBI in foreign exchange market, the speculative demand in the Iranian foreign exchange market following the surge in the dollar index led the free market rate to increase along with the index, but at a slower pace.
Unlike its free market rate, the official US dollar/rial exchange rate did not fluctuate much and grew by an average of 2.4% in the two preceding quarters.
As the dollar/rial free market exchange rate grew faster than the official rate, the gap between the two rates widened from 14% at the end of 05/1395 to 21% at the end of 9/1395. This became an excuse for CBI to once again postpone the exchange rate unification at least till next year.
Figure 4 exhibits the average annual inflation rate and the average growth rates of official and free market dollar/rial exchange rates during the nine months of 1395.