It is now clear that the purpose of US sanctions against Iran is to make its people miserable enough so they pressure their government to agree to US demands.
One obvious response to this strategy is for the Iranian government to shift resources to groups most likely to feel and transmit these pressures. If the government has such a plan, who to protect and how, it seems lost in the chaos of the exchange rate market and reshuffling of government ministers.
Perhaps the past can be a guide: How did Iran manage the last phase of sanctions when, in July 2011, President Barack Obama ratcheted them up, reads an article recently published by Iranian economist Djavad Salehi Isfahani. Below is the full text:
I answer this question by looking at the consumption of four basic food items using unit record data from the Household Expenditure and Income Surveys for various years. These surveys allow us to measure the amount consumed of meat, chicken, rice and bread, for individuals living in poor and rich households.
Looking at quantities can tell us how accurate are the accounts or high and rising poverty is in Iran, which have been written from a perspective critical of both Iran and US sanctions.
In the latter piece, in which I find much to agree with, Peter Beinart writes, “Between 2012 and 2014, the percentage of Iranian families living in poverty almost doubled. By 2016, according to the BBC, Iranians were consuming just over half as much red meat, and just under half as much bread, as they had in 1996.” How true are these claims?
On poverty, you can find a rigorous assessment of poverty in the 2016 World Bank working paper. This paper puts Iran’s poverty rate in 2014 at less than 10% of the population. The paper also shows that the increase in poverty during 2012-14 was much more modest, from 7.1-9.5%, despite intensifying sanctions.
Sanctions will likely do the same this time around, and maybe worse, because the cash transfer scheme, which lifted incomes of the households below the median by more than 28%, is no longer working.
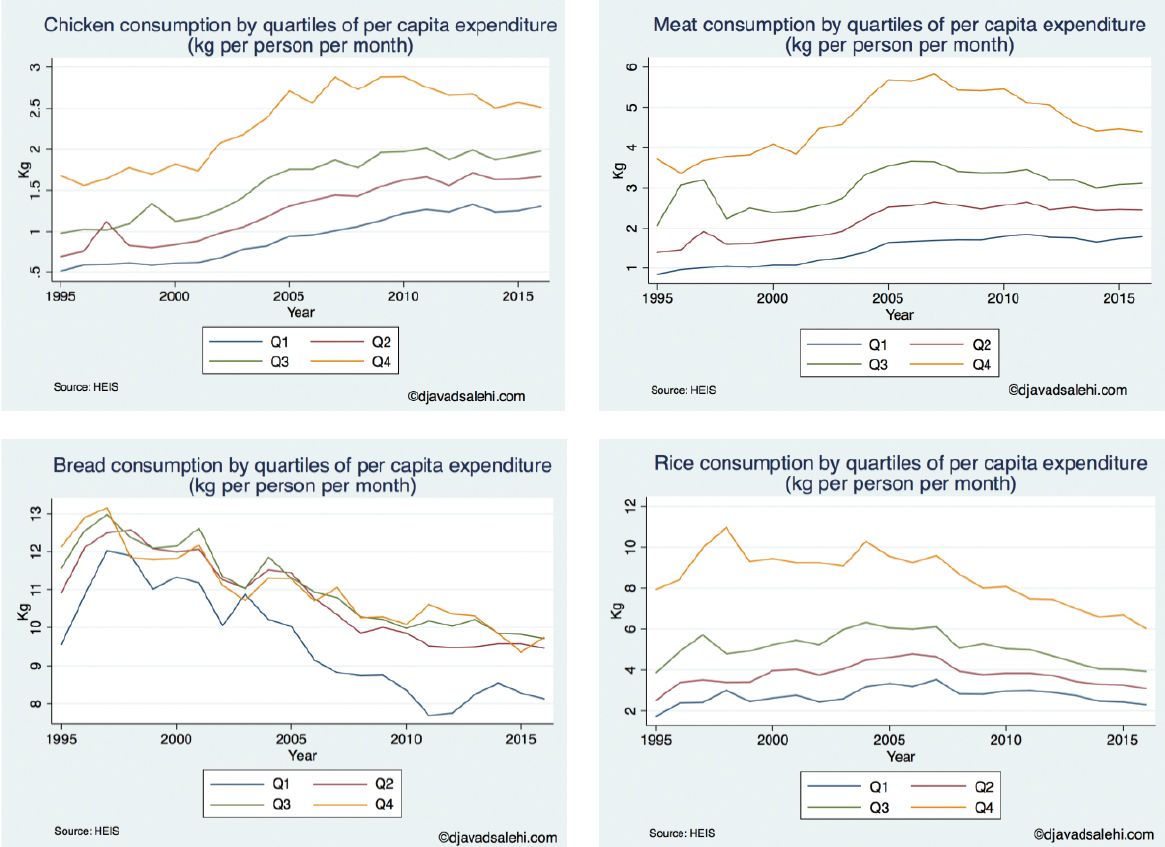
But if you find poverty rate calculations too subjective, you may find data on food consumption (by weight) more convincing. The graphs show consumption of meat, chicken, bread and rice per kilogram per person using survey data collected by the Statistical Center of Iran and made available in unit record online.
The graphs divide the population into groups by quartile of income. So Q1 are the poorest 25% of the population, Q2 the lower middle class, and so on.
The graphs reasonably depict the gap in consumption between the four income groups: large differences in consumption of chicken, red meat and rice between the top quartile and the rest, and smaller gaps for bread.
But the trends over time tell a different story than the widely reported BBC report mentioned above. My calculations show that over the same 20-year period as in the BBC report there has been a substantial rise in consumption of protein per capita by the poor (lowest quartile): chicken by 120%, followed by meat by 85%. Consumption of rice is the same in 2016 as it was 20 years ago.
The decline in consumption of bread, from about 10.9 kg per person per month to 8.1 kg, is not necessarily a sign of deprivation. It is a good thing, in my view, that Iranians have reduced their bread consumption closer to the global average and the same as in Turkey.
So, what explains the difference between these results and those reported by the BBC? The answer is not difficult to find. The BBC report relies on Central Bank household expenditure surveys, which are collected in urban areas only and are at the household level. The SCI surveys I use here are nationally representative and the variables depicted in these graphs are per capita.
For both reasons, the BBC report does not measure consumption per person at the national level correctly. First, between 1996 and 2016, millions of rural residents, who are generally poorer, have been reclassified as urban, bringing the urban average consumption figures down.
For a purely administrative matter, Iranian villages that reach 5,000 in population size can petition to become urban and often succeed. Between 1996 and 2016, the number of urban centers doubled, going from 612 to 1,245.
Second, family size has declined over time, from 6.2 in 1996 to 4.1 in 2016, which can cause the trends in per capita and total household consumption to be quite different, one going up while the other falls.
How about changes in food consumption right after sanctions hit?
Bread consumption fell by 8% in 2011 compared to 2010, but not meat or chicken, and rice consumption did not change. What is special about bread? Not sanctions.
As part of the 2010 Targeted Subsidy Reform program of former president, Mahmoud Ahmadinejad, its price doubled in December 2010. The other food items were not part of the package, so only bread consumption fell. Bread consumption recovered some in later years, as its price remained the same while other prices increased. Since sanctions tightened rather than ease as the years went by, it is safe to conclude that sanctions were not responsible for the decline in bread consumption in 2011.
Will the same happen this time around? Can the government make good on its promise of “protecting the people’s livelihood”, as President Hassan Rouhani put it recently?
As I said, I have not heard a more precise policy discussed, but the government intends to preserve its foreign exchange reserves for “essential items”, and is starving the non-official market.
But it lacks one important tool, which was available to Rouhani’s predecessor and protected a large section of the population during the 2011-12 economic crisis—cash transfers.
The real value of the transfers is down by at least two-thirds since 2011, from $90 per person per month to about $30.