According to the Central Bank of Iran, Iran’s average daily oil exports (including crude oil and oil products) rose by 41.2% in the last Iranian year’s (started March 20, 2016) first quarter and 34.6% in Q2 to surpass 2 million bpd.
Despite the rise in Iran’s crude oil price from the low of $24.1 per barrel in the month ended Jan. 19, 2016, according to OPEC reports, the average price during the first half of the last Iranian year was still 23.3% below that of the corresponding period of the year before.
Overall, the value of oil exports (including crude oil, oil products, natural gas, natural gas condensates and liquids) rose by 23.6% during the period while the imports fell by 42.7% to reach $624 million. The balance of oil trade rose by 27.4% to reach $24.2 billion, reads a quarterly report published by the Middle East Bank.
The full text of the “Balance of Payment” section follows:
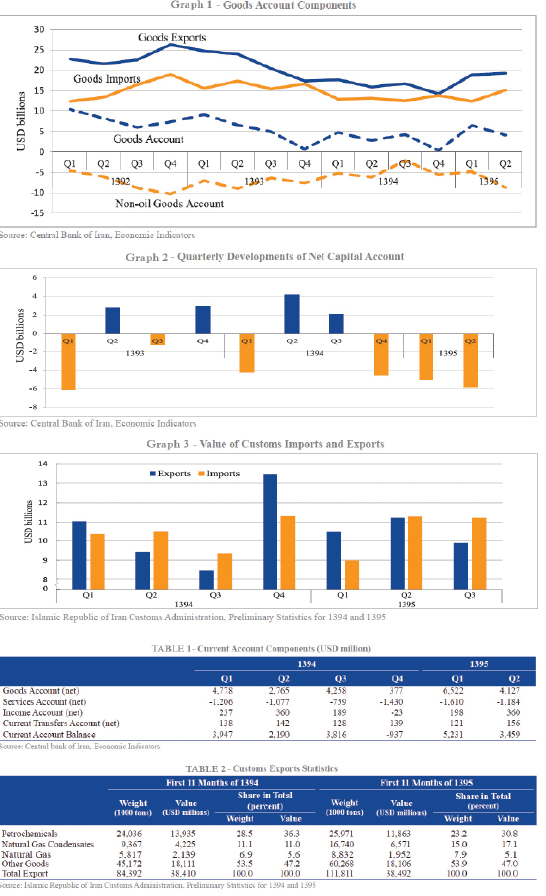
Non-oil exports decreased by 1.6% in value and non-oil imports increased by 7.6% in 1395H1, reaching $13.3 billion and $26.9 billion, respectively. Accordingly, the non- oil trade deficit reached $13.5 billion, showing an 18.4% rise in that period. Graph 1 depicts the goods account components from 1392Q1 to 1395Q2.
The 13.5% rise in the value of goods exports in conjunction with the 5.5% rise in the value of goods imports resulted in a 41.2% increase in goods account to $10.6 billion in the first half of the last Iranian year.
The services account deficit also increased in that period as a result of the rise in net imports, but changes in income account and current transfers account were negligible.
Overall, the net current account rose by a 41.6% during the period mostly as a result of the increase in goods account and reached $8.7 billion. Table 1 shows current account components from Q1 of the fiscal March 2015-16 to Q2 of the fiscal March 2016-17.
Disappointing many who expected capital inflow to increase following the implementation of the Joint Comprehensive Plan of Action (the official name of the nuclear deal Iran signed with world powers in 2015), data on net capital account indicates $15.4 billion net outflow during the nine months of the fiscal March 2015-16 and the first half of March 2016-17. Graph 2 presents capital account developments from Q1 of the fiscal March 2014-15 to Q2 of the fiscal March 2016-17.
Given $5.5 billion of errors and omissions during the first half of the last Iranian year, Iran’s foreign reserves appear to have decreased by $7.6 billion during this period and reached $120.8 at the end of Sept. 21, 2016.
In Q3 of the last Iranian year, the value of exports (excluding oil and suitcase trade) experienced a 12.0% fall from its preceding quarter but rose by 16.4% from Q# of the fiscal March 2015-16.
Imports also experienced a 0.7% fall from its preceding quarter but rose by 20.0% from Q3 of the fiscal 2015-16.
Graph 3 exhibits the values of imports and exports from Q1 of the fiscal March 2015-16 to Q3 of the fiscal March 2016-17. The latest statistics indicate that the values of imports and exports in the 11 months of the last Iranian year reached $38.4 billion and $38.5 billion, respectively, indicating a rise of 3.5% and 0.2%.
During this period, the export of petrochemicals and liquefied natural gas dropped by 14.9% and 8.7%, respectively, while those of natural gas condensates rose by 55.5%. Exports of other goods did not change much in this period. The value of LNG exports fell, despite the 51.8% rise in its volume.
Accordingly, the aggregate value of exports compared to the same period in the preceding year did not fall since exports in the four aforementioned groups rose.
Table 2 shows export data by these groups for the 11 months of the last Iranian year.
During this period, natural gas condensates and LNG were the main export items followed by $1.4 billion in light crude export, except gasoline, $1.1 billion in liquefied petroleum gas export and $1.0 billion in the export of liquefied propane gas.
The main export destinations were China, the UAE, Iraq, Turkey and South Korea.
A notable development is the jump in South Korea’s share of Iran’s exports from 1.7% in the 11 months of the fiscal March 2015-16 to 7% in the 11 months of the fiscal March 2016-17.
Cattle-feed corn valued at $1.3 billion, soybean at $848 million and auto parts at $730 million were the main import items in the 11 months of the fiscal March 2016-17. China, the United Arab Emirates, South Korea, Turkey and Germany were the main sources of imports in this period. Imports from China accounted for about 25% of the total imports.