Contrary to the unpredictable chronology of domestic and foreign events that have influenced the path of Tehran Stock Exchange over the past two years, some economists are resorting to the golden mean of Fibonacci to predict the future.
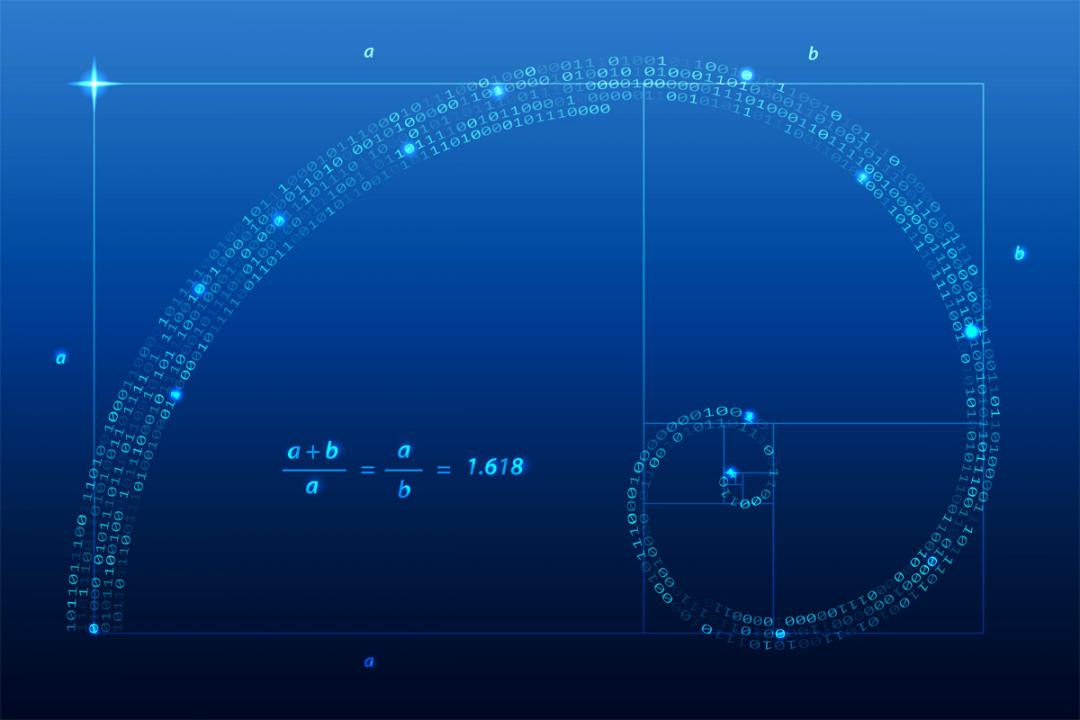
The Fibonacci proportion is often used by financial traders to guesstimate stock market cycles. This ratio is obtained by dividing any pairs in the Fibonacci sequence, which starts with one and continues by infinitely summing up the preceding two numbers – 1, 1, 2, 3, 5, 8, etc…
The Fibonacci ratio, which is 1.618, has been given almost omnipotent explanatory powers after it was found to constitute mathematic relationships in nature ranging from the distance between body parts, the ratio of male to female bees and even the distance between DNA cells. Psychological study has also shown the prevalence of Fibonacci ratios in human decision-making, which in turn paved the way for traders to start using the number extensively in market forecast and analysis.
However, stock markets where Fibonacci ratios are used differ in one crucial aspect from the TSE: While the former are the result of collective responses to an almost infinite range of interrelated economic and political events and decisions, the TSE has been dominated by the monotonous drone of international nuclear negotiations between Iran and P5+1.
Newspaper Forsat-e Emrooz published an article by Pashoutan Mashhouri-Nejad, a capital market analyst, who employs Fibonacci to predict three possible scenarios for when the stock market will pick up, depending on the exact chronology and outcome of important political and economic decisions.
In stock markets, Fibonacci ratios are used in percentages correlating to various stages between the local maximum and minimum of a market index. In other words, every single up- or down-turn can be analyzed using this proportion, as can the path of the entire index for a specific time period.
Mashhouri-Nejad recognizes four movements since the beginning of the current Iranian year (starting March 21, 2015) – two bull and two bear markets. These two cycles correspond to two important achievements in the nuclear negotiations: the first is the agreement on the framework of the final deal in early April and the second is the final signing of the nuclear deal in mid-July.
Each time, the bull market ended suddenly and sharply when fears about the outcome of negotiations overtook initial optimism. Now for the first time, the TSE is in a situation in which market participants have high expectations that worries about the continuation of a sanctions regime are a matter of the past.
According to Fibonacci trends, Mashhouri-Nejad predicts three levels at which the next bull market begins. The first, which he believes is the most likely, occurs when the index hovers between 64,200 and 64,000, which is 300 points below the current 64,500–an expansion at Fibonacci’s 161.8%. This situation assumes that the nuclear deal will be approved both in Congress and Majlis, with risk-loving traders jumping on undervalued share in the hope of a quick gain. Short-termism and speculation have been a feature of the TSE over the past year and there is no reason to assume it will disappear in the coming months.
The second scenario would see prices falling to the 63,200 threshold if the Securities and Exchange Organization allows trading to resume in the Bandar Abbas Oil Refining Company, Golgohar and other large companies with suspended ticker symbols. The SEO is unlikely to take these actions before the start of October, as Lia Company’s share debut last week has already saturated demands.
In the last and most depressing scenario, the nuclear deal is rejected, sharply boosting the chance that the sanctions regime will not be removed. This would imply that the TSE returns to its long-term downward Fibonacci trend, postponing hopes for a rally until the main index falls to at least 57,000.
Whether Fibonacci will be as good a guidance to future prices at the TSE as it has been in predicting the ratio between the diameters of two seed rotations in a sunflower remains to be seen. However, it has already shown its value in keeping economists intensely busy in plotting the point of return to a bull market.